x <- 1:10해당 자료는 전북대학교 이영미 교수님 2023고급시계열분석 자료임
TS기본
예시1
class(x)
'integer'
x <- ts(1:10)class(x)
'ts'
x <- ts(rnorm(50), start=c(2000,1), frequency=12) start=c(2000,1) 은 2000년도 1월부터 시작, frequency=12로 설정하면 월별 데이터
frequency=4로 하면 분기별로
frequency=52로 하면 주별로
frequency=1로 하면 1년
x| Jan | Feb | Mar | Apr | May | Jun | Jul | Aug | Sep | Oct | Nov | Dec | |
|---|---|---|---|---|---|---|---|---|---|---|---|---|
| 2000 | 0.76405413 | -1.02349881 | -0.51959564 | 0.01864085 | -0.60774019 | 0.14672756 | 1.29754383 | -0.48970178 | 0.63146949 | 0.95926188 | -0.25685314 | -1.29338383 |
| 2001 | -1.59141361 | 0.40743501 | 1.75707309 | -0.99527927 | -1.14542320 | -0.37712164 | 1.17125683 | -1.77853599 | 0.88462388 | 0.38648820 | 0.63353985 | 0.14774167 |
| 2002 | -1.27983177 | 0.40469783 | -0.79593176 | -0.92399600 | 0.47708488 | 0.23482996 | -1.47308579 | 0.52336346 | 1.52855291 | -0.22313437 | 0.28595267 | -1.98182541 |
| 2003 | 0.60718388 | -1.21229303 | -0.62694271 | 1.66803342 | -0.32590005 | -1.07216211 | -0.66451496 | -0.54215015 | -0.73426974 | -0.91737960 | 0.92539709 | 0.44326098 |
| 2004 | -0.57459795 | 0.84987553 |
cycle(x) #주기| Jan | Feb | Mar | Apr | May | Jun | Jul | Aug | Sep | Oct | Nov | Dec | |
|---|---|---|---|---|---|---|---|---|---|---|---|---|
| 2000 | 1 | 2 | 3 | 4 | 5 | 6 | 7 | 8 | 9 | 10 | 11 | 12 |
| 2001 | 1 | 2 | 3 | 4 | 5 | 6 | 7 | 8 | 9 | 10 | 11 | 12 |
| 2002 | 1 | 2 | 3 | 4 | 5 | 6 | 7 | 8 | 9 | 10 | 11 | 12 |
| 2003 | 1 | 2 | 3 | 4 | 5 | 6 | 7 | 8 | 9 | 10 | 11 | 12 |
| 2004 | 1 | 2 |
- 주기
- 분해법 같은 거 할 때 주기가 설명변수로 들어갈 때가 있다.
class(cycle(x))
'ts'
time(x)| Jan | Feb | Mar | Apr | May | Jun | Jul | Aug | Sep | Oct | Nov | Dec | |
|---|---|---|---|---|---|---|---|---|---|---|---|---|
| 2000 | 2000.000 | 2000.083 | 2000.167 | 2000.250 | 2000.333 | 2000.417 | 2000.500 | 2000.583 | 2000.667 | 2000.750 | 2000.833 | 2000.917 |
| 2001 | 2001.000 | 2001.083 | 2001.167 | 2001.250 | 2001.333 | 2001.417 | 2001.500 | 2001.583 | 2001.667 | 2001.750 | 2001.833 | 2001.917 |
| 2002 | 2002.000 | 2002.083 | 2002.167 | 2002.250 | 2002.333 | 2002.417 | 2002.500 | 2002.583 | 2002.667 | 2002.750 | 2002.833 | 2002.917 |
| 2003 | 2003.000 | 2003.083 | 2003.167 | 2003.250 | 2003.333 | 2003.417 | 2003.500 | 2003.583 | 2003.667 | 2003.750 | 2003.833 | 2003.917 |
| 2004 | 2004.000 | 2004.083 |
예시2
x <- rnorm(100)class(x)
'numeric'
t <- 1:100plot(t,x, type='l')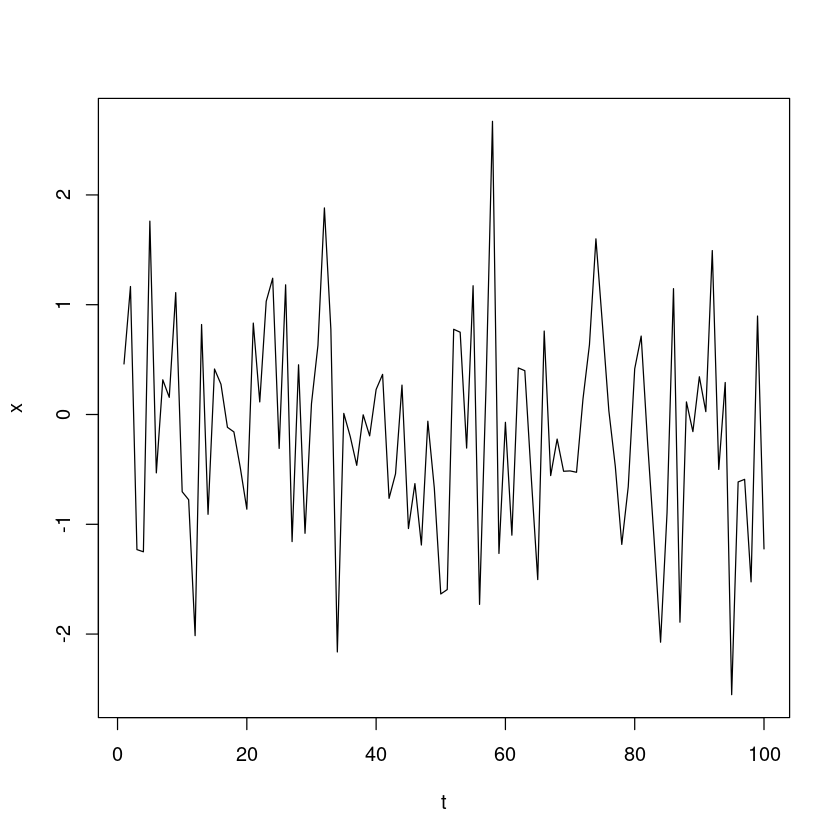
- type=‘l’ 하면 선으로 그려짐
y <- as.ts(x)class(y)
'ts'
plot(y)
- y를 ts로 바꿔준 후 plot그리면 바로 선으로 그려짐
plot.ts(x)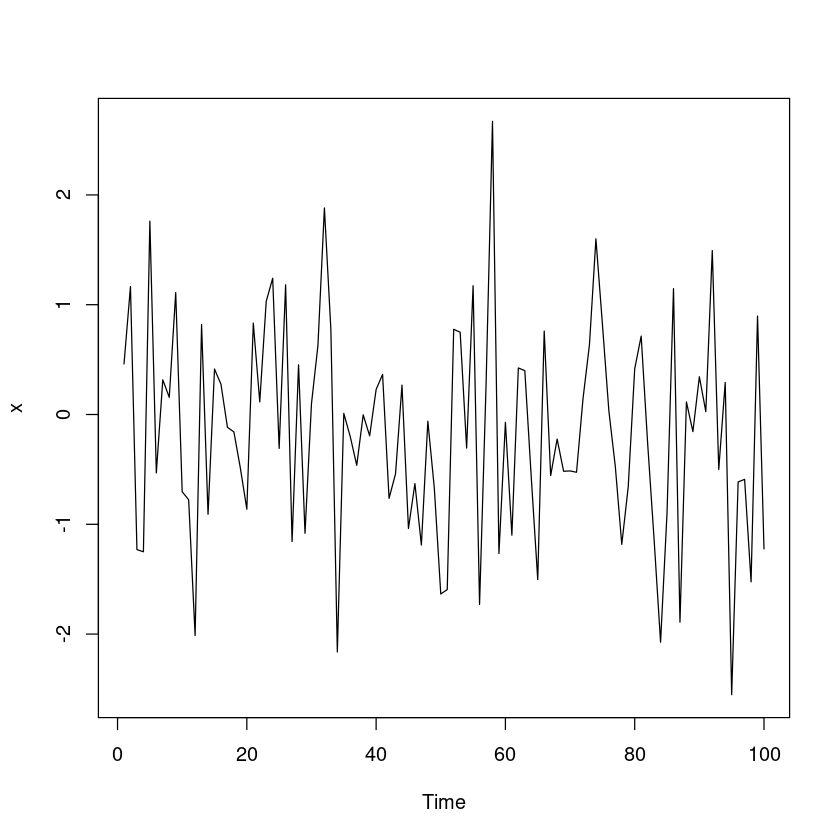
ts.plot(x)
예시3
z <- ts(matrix(rnorm(300), 100, 3), start=c(2000), frequency=12)z| Series 1 | Series 2 | Series 3 | |
|---|---|---|---|
| Jan 2000 | 1.29698875 | -1.21674471 | -1.045034994 |
| Feb 2000 | 0.25714581 | -0.46422565 | 0.483273186 |
| Mar 2000 | -1.69609518 | 0.11543522 | 1.394646640 |
| Apr 2000 | -0.02172058 | 0.43036387 | 0.905497648 |
| May 2000 | -0.39205715 | -0.27943394 | 1.358016569 |
| Jun 2000 | 0.50886335 | 0.85316956 | -1.895619864 |
| Jul 2000 | -1.80530553 | 1.71537527 | 1.329138264 |
| Aug 2000 | -1.46328716 | -0.31392842 | 0.742000641 |
| Sep 2000 | -1.38169601 | -1.26421866 | -0.191226610 |
| Oct 2000 | -0.01805485 | 0.93875696 | 2.068855082 |
| Nov 2000 | -0.34166996 | -1.61838098 | 0.639833161 |
| Dec 2000 | 2.18777732 | 0.62720494 | 1.453509388 |
| Jan 2001 | -0.48260923 | -0.28668534 | 1.773957684 |
| Feb 2001 | -0.16098004 | -1.01794429 | -0.183156085 |
| Mar 2001 | 0.59254034 | 2.47052543 | -0.809340939 |
| Apr 2001 | -0.58943389 | 0.82159951 | 0.352739904 |
| May 2001 | -1.45154532 | -0.43198993 | 0.665977309 |
| Jun 2001 | 0.46219480 | 0.19420399 | -0.262522937 |
| Jul 2001 | 0.74171572 | 0.88243415 | 0.892556497 |
| Aug 2001 | -0.53807879 | -0.58672603 | 0.545136112 |
| Sep 2001 | 0.65559328 | 0.91101814 | -2.056745676 |
| Oct 2001 | 0.36380952 | 0.26730273 | 0.553534241 |
| Nov 2001 | 0.49678797 | 0.72762693 | 1.365226501 |
| Dec 2001 | 1.14095522 | -1.30247190 | 1.510088305 |
| Jan 2002 | -1.39845866 | 1.80914173 | 0.247411534 |
| Feb 2002 | 0.54354719 | 0.40637855 | 2.951693379 |
| Mar 2002 | 0.74456311 | -0.97149128 | -0.424397231 |
| Apr 2002 | 0.67847157 | -1.33946923 | -1.009035652 |
| May 2002 | -0.71580510 | -1.03397342 | 0.740221981 |
| Jun 2002 | -0.41755001 | -0.10206794 | 1.570414318 |
| Jul 2002 | 0.17680380 | 0.43245983 | 1.625357479 |
| Aug 2002 | -0.95681583 | -0.32390645 | -0.709353518 |
| Sep 2002 | 0.78065065 | 2.76478866 | -0.127425483 |
| Oct 2002 | 1.02147488 | 0.26340296 | -1.306210735 |
| Nov 2002 | -0.61802357 | 0.73282875 | -0.779533677 |
| Dec 2002 | -0.98624272 | -0.90351530 | 0.559447943 |
| Jan 2003 | -1.67644507 | -0.96854559 | 0.352028417 |
| Feb 2003 | -0.02038246 | -1.14873244 | 0.313497750 |
| Mar 2003 | -0.26066156 | -0.33632808 | 0.456722618 |
| Apr 2003 | 1.67542156 | 1.21970305 | 0.230345692 |
| May 2003 | 0.26359387 | 0.71395285 | 1.116902239 |
| Jun 2003 | 1.45528996 | 1.10804737 | 0.542625091 |
| Jul 2003 | -0.71892538 | 0.35460415 | 0.863238040 |
| Aug 2003 | -1.31576484 | -0.49592678 | 1.783651647 |
| Sep 2003 | -0.20677657 | 0.94086539 | 0.108162065 |
| Oct 2003 | -0.41455675 | -0.63930979 | -0.520634930 |
| Nov 2003 | -0.53695148 | -1.29420682 | 1.743452058 |
| Dec 2003 | 0.85407196 | -0.45433578 | -0.090949969 |
| Jan 2004 | 0.49875472 | 0.74599358 | 0.114811798 |
| Feb 2004 | -0.21734313 | -1.55225754 | -0.295416275 |
| Mar 2004 | -0.16518469 | 0.63871891 | -0.307326165 |
| Apr 2004 | 1.34706900 | -0.81975832 | 0.841763649 |
| May 2004 | 1.46561716 | 0.05836098 | 1.370650302 |
| Jun 2004 | 0.91005600 | 1.48060158 | -0.924395745 |
| Jul 2004 | 1.75993687 | 0.53251578 | 0.007020867 |
| Aug 2004 | -1.33355445 | -0.66142666 | -0.956165251 |
| Sep 2004 | -2.32004900 | 0.49294086 | 0.438495174 |
| Oct 2004 | -1.28912660 | 0.37384792 | -0.721941570 |
| Nov 2004 | -0.89574330 | -1.18158398 | -0.308383156 |
| Dec 2004 | -2.16302760 | 0.61114109 | -0.159999432 |
| Jan 2005 | 0.06904502 | 0.45510869 | 0.542888786 |
| Feb 2005 | -1.76391821 | -0.37935623 | 0.674218646 |
| Mar 2005 | 2.27249463 | -1.01247888 | -0.794283698 |
| Apr 2005 | 0.20353326 | -2.09981742 | -2.445789016 |
| May 2005 | -0.34161710 | -0.11308729 | 1.194669309 |
| Jun 2005 | -0.47317357 | -0.96164561 | -1.105428534 |
| Jul 2005 | 0.88899272 | -0.46110042 | 1.018510347 |
| Aug 2005 | -1.21056402 | 0.94189524 | -0.154002748 |
| Sep 2005 | 1.27189344 | -0.09086265 | 0.853223269 |
| Oct 2005 | 2.43673610 | -0.38708700 | -0.114912446 |
| Nov 2005 | -0.70430531 | 0.29337553 | -0.231400148 |
| Dec 2005 | 0.21192641 | 1.08547553 | 1.758685933 |
| Jan 2006 | -0.36607787 | -0.21454928 | 0.604770490 |
| Feb 2006 | 2.74487541 | 0.37143248 | -1.804909791 |
| Mar 2006 | -0.06660497 | -0.49540231 | 0.520447152 |
| Apr 2006 | -0.36036564 | -0.65447797 | 1.101548824 |
| May 2006 | 0.03937687 | 0.29065032 | 0.710582404 |
| Jun 2006 | 1.20196082 | -2.38804583 | -0.661208046 |
| Jul 2006 | 2.42037478 | 0.92585911 | -0.164038692 |
| Aug 2006 | -0.81440983 | -1.34864791 | -0.349078183 |
| Sep 2006 | 0.55318248 | -0.76005851 | 0.442683600 |
| Oct 2006 | -1.66074158 | 0.09216394 | -1.290911876 |
| Nov 2006 | -1.53176534 | -0.28728584 | -1.336682588 |
| Dec 2006 | -0.21676828 | -0.10978893 | -0.898920033 |
| Jan 2007 | -0.05676096 | 0.88120659 | -1.211459957 |
| Feb 2007 | 1.60050550 | 1.10863397 | 0.801239884 |
| Mar 2007 | 1.18151898 | 1.22710760 | 0.234467028 |
| Apr 2007 | 1.86273043 | 0.64789357 | 0.968746102 |
| May 2007 | -0.19704726 | -0.31664389 | 0.115593106 |
| Jun 2007 | -0.80236520 | -0.46278229 | -0.798281008 |
| Jul 2007 | -0.57023657 | -0.28156889 | 1.988958919 |
| Aug 2007 | 0.39209971 | -2.77298749 | 1.456734626 |
| Sep 2007 | -2.58484490 | 1.01233158 | 0.106086064 |
| Oct 2007 | 1.57908149 | -0.75397813 | -0.442861061 |
| Nov 2007 | 0.08697194 | -1.82803417 | -1.439861978 |
| Dec 2007 | -0.26444040 | 0.56057798 | 0.428862529 |
| Jan 2008 | 0.65498531 | -2.29645430 | -0.144352451 |
| Feb 2008 | 2.18246630 | 0.00740514 | 0.010789788 |
| Mar 2008 | -0.79253588 | -0.35783010 | -1.029779770 |
| Apr 2008 | 1.31979636 | 0.09844285 | -0.198100075 |
plot(z)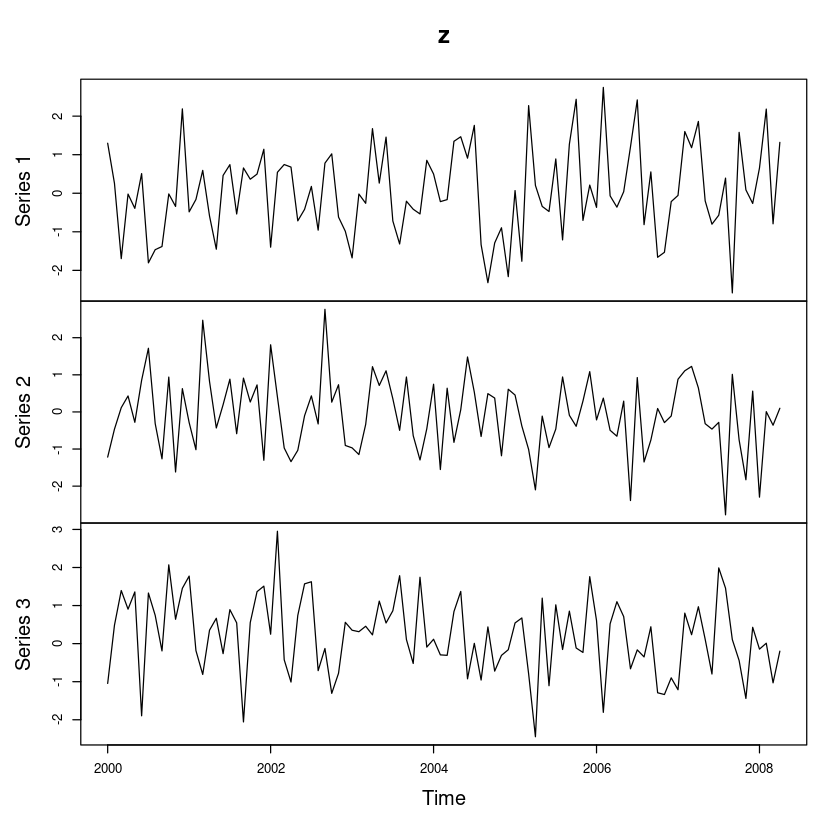
plot.ts(z)
plot.ts(z, plot.type="single", col=1:3, lty=1:3)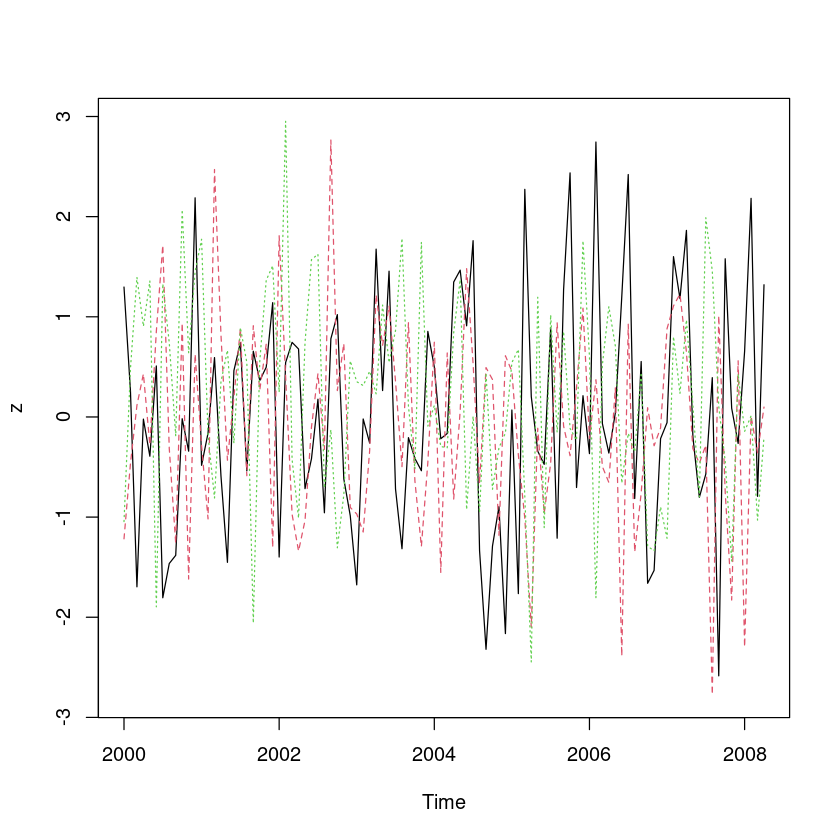
ts.plot(z, col=1:3)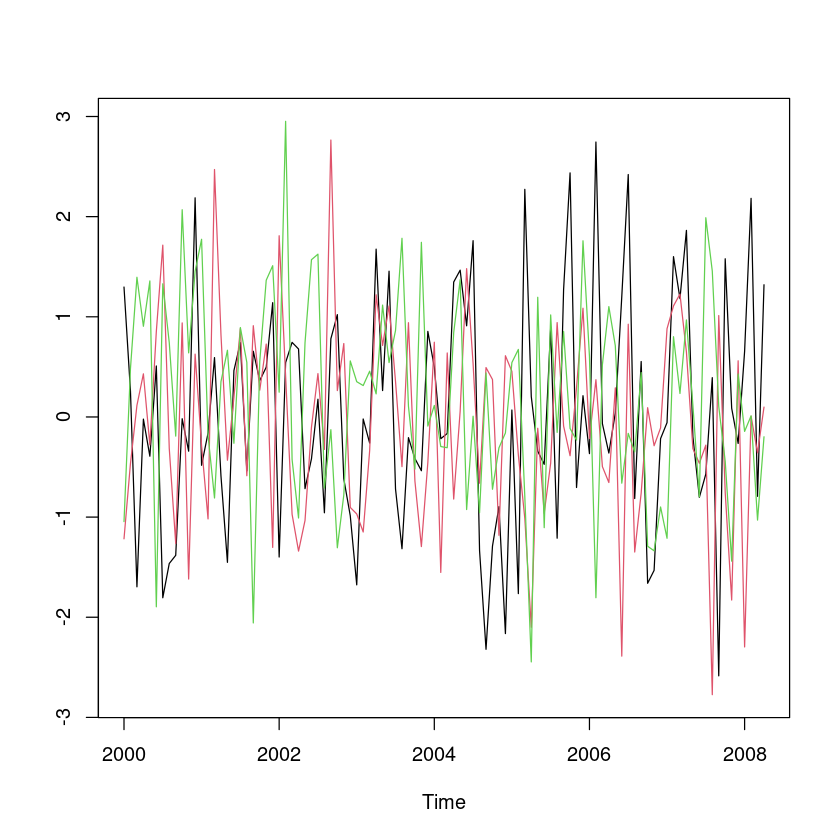
예시4: iris 데이터
head(iris)| Sepal.Length | Sepal.Width | Petal.Length | Petal.Width | Species | |
|---|---|---|---|---|---|
| <dbl> | <dbl> | <dbl> | <dbl> | <fct> | |
| 1 | 5.1 | 3.5 | 1.4 | 0.2 | setosa |
| 2 | 4.9 | 3.0 | 1.4 | 0.2 | setosa |
| 3 | 4.7 | 3.2 | 1.3 | 0.2 | setosa |
| 4 | 4.6 | 3.1 | 1.5 | 0.2 | setosa |
| 5 | 5.0 | 3.6 | 1.4 | 0.2 | setosa |
| 6 | 5.4 | 3.9 | 1.7 | 0.4 | setosa |
t.iris <- as.ts(iris[,-5])- 마지막 자료는 범주형 자료라서 빼줌
class(t.iris)- 'mts'
- 'ts'
- 'matrix'
- mts: multiple time series
t.iris[10,3]
Petal.Length: 1.5
- matrix에 사용하는 모든 함수 같은걸 사용할 수 있다.
head(t.iris)| Sepal.Length | Sepal.Width | Petal.Length | Petal.Width |
|---|---|---|---|
| 5.1 | 3.5 | 1.4 | 0.2 |
| 4.9 | 3.0 | 1.4 | 0.2 |
| 4.7 | 3.2 | 1.3 | 0.2 |
| 4.6 | 3.1 | 1.5 | 0.2 |
| 5.0 | 3.6 | 1.4 | 0.2 |
| 5.4 | 3.9 | 1.7 | 0.4 |
plot.ts(t.iris)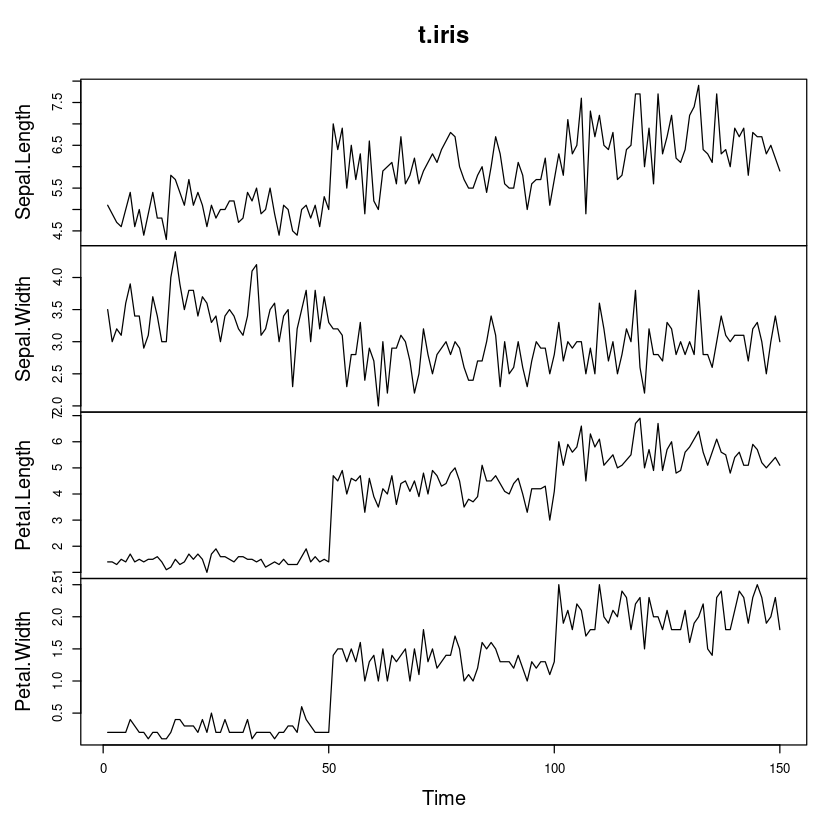
ts.plot(t.iris, col=1:4)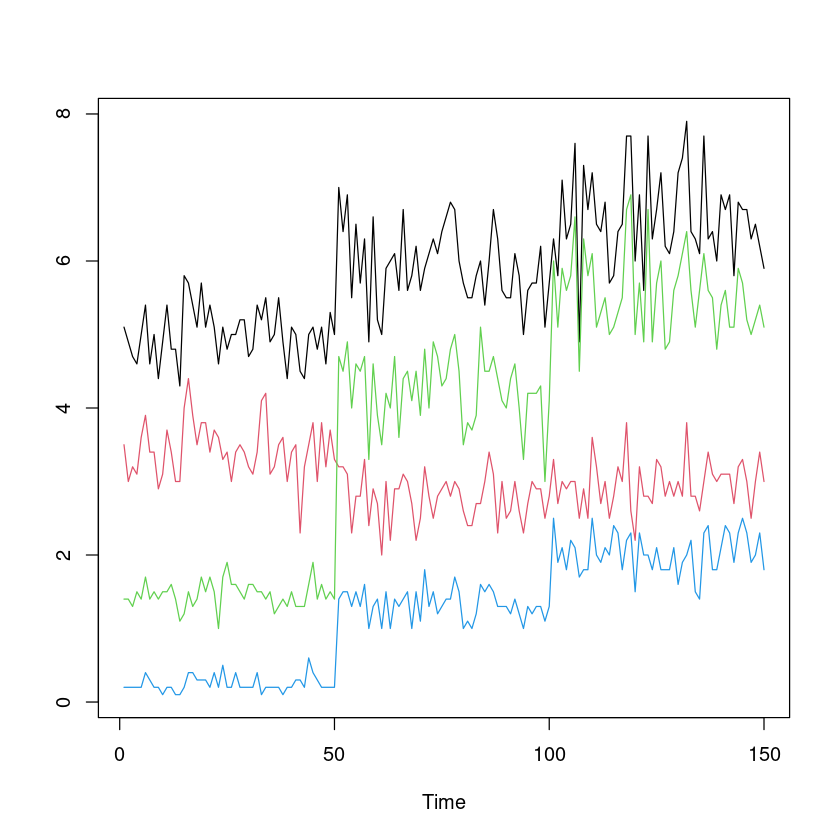
Date
\(r_{t,3M} = \frac{y_{t+3M}}{y_t}-1\)
3개월 후의 수익률을 구한다 =
Sys.Date()- 현재 날짜 불러옴
date()
'Sun Sep 17 16:26:57 2023'
- 현재 날짜와 시간
a <- Sys.Date()class(a)
'Date'
a <- "2023-09-17"
a
'2023-09-17'
class(a)
'character'
a_date <- as.Date(a)a_date- 따옴표가 사라짐!
class(a_date)
'Date'
a <- as.Date(c("2023-09-17","2024-01-01"))
aa[2] - a[1]Time difference of 106 daysa_chr <- as.character(a)a_chr- '2023-09-17'
- '2024-01-01'
a_chr[2] - a_chr[1]ERROR: Error in a_chr[2] - a_chr[1]: non-numeric argument to binary operator- 문자라 안됨
a[1] + 7a[1] - 7a[1]format(a[1], format="%B-%d-%y")
'9월-17-23'
as.Date("2023-09-17")b <- as.Date("09/17/23", format="%m/%d/%y")as.Date("09/17/23")로 하면 09년으로 파악할 수도 있으므로 위에처럼 format형식을 지정해주는 것이 좋다.
bweekdays(b)
'일요일'
# ?Date# ?format# ?as.DateLubridate package 활용하기
install.packages("lubridate")Installing package into ‘/home/coco/R/x86_64-pc-linux-gnu-library/4.2’
(as ‘lib’ is unspecified)
Warning message in install.packages("lubridate"):
“installation of package ‘lubridate’ had non-zero exit status”library(lubridate)
Attaching package: ‘lubridate’


The following objects are masked from ‘package:base’:

    date, intersect, setdiff, union
날짜, 시간 정보를 추출
a <- today()aclass(a)
'Date'
year(a)
2023
month(a)
9
day(a)
17
wday(a)
1
- 기본세팅 1:일요일, 2: 월요일 …
wday(a, label=TRUE)
일
Levels:
- '일'
- '월'
- '화'
- '수'
- '목'
- '금'
- '토'
class(wday(a,label=TRUE))- 'ordered'
- 'factor'
now()[1] "2023-09-17 16:41:22 KST"class(now())- 'POSIXct'
- 'POSIXt'
now <- now()hour(now)
16
minute(now)
41
second(now)
29.3091588020325
ymd("2023-09-17")- ymd: year month day
mdy("09-17-23")ymd(20230917)ymd("2023 Sep 17") # locale="USA")- 뒤에 locale 하면 안되넹
ymd("2023/09/17")a <- ymd_hms("2023-09-17 09:00:00", tz="Asia/Seoul")- hms: 시간
ymd_hms("2023-09-17 09:00:00")[1] "2023-09-17 09:00:00 UTC"ymd_hms("2023-09-17 09:00:00", tz="Asia/Seoul")[1] "2023-09-17 09:00:00 KST"a[1] "2023-09-17 09:00:00 KST"with_tz(a, tz="America/New_York")[1] "2023-09-16 20:00:00 EDT"tz: time zone
한국은 현재 9.17. 인데 미국은 9. 16.일수도 있음. 미국을 9. 17.로 바꾸어버리면 한국 기준으로 미국의 데이터는 미래 데이터인 경우가 있다! 그러므로 time zone을 생각해야함!!ㅡ
설명변수에 미래변수가 있으면 안된다.
ym(202309)hms("11:30:00")
11H 30M 0S
hm("11:30")
11H 30M 0S
now <- now()now[1] "2023-09-17 16:43:59 KST"update(now, years=2000)[1] "2000-09-17 16:43:59 KST"- 필요한 날짜만 변경